The on-chain analytics company, Glassnode, has shed light on the potential price level Bitcoin needs to hit to reach its historical peak according to their pricing model.
Glassnode, in a recent post, discussed the euphoria threshold of Bitcoin’s Market Value to Realized Value (MVRV) Pricing Bands. This pricing model is built around the MVRV Ratio.
The MVRV Ratio is a widely followed on-chain metric that tracks how the market value of Bitcoin held by investors compares to the value they initially invested, known as the realized cap. When this number exceeds 1, it means investors are collectively experiencing profits as their holdings surpass their initial investments. Conversely, if it falls below that threshold, it suggests the market is largely at a loss.
Over time, when many investors are in profit, it often points to overheated conditions for Bitcoin, indicating potential large-scale sell-offs as people look to lock in gains. Conversely, when loss dominates, it usually hints at market bottoms since there are fewer sellers at this stage.
The MVRV Pricing Bands are designed to highlight these relationships by setting certain price levels that align with key points on the MVRV Ratio.
In a chart shared by Glassnode, we can observe how these Bitcoin pricing bands have shaped up over the years:
The chart indicates BTC is currently below the last two bands in this model.
The 0.8 pricing band, where the MVRV Ratio equals 0.8, has traditionally marked where Bitcoin’s bear market lows have formed. Presently, Bitcoin’s price is well above this point at $33,100. It’s also quite far from the 1.0 level, valued at $41,300, which represents the cost basis of an average investor’s address on the network.
Currently, Bitcoin is trading beneath the 2.4 and 3.2 pricing bands, positioned at $99,300 and $132,400 respectively. Historically, when Bitcoin approaches the 2.4 level, it signals the bull market is heating up.
Bitcoin can hover in this range, but surpassing the 3.2 level often suggests a peak is near.
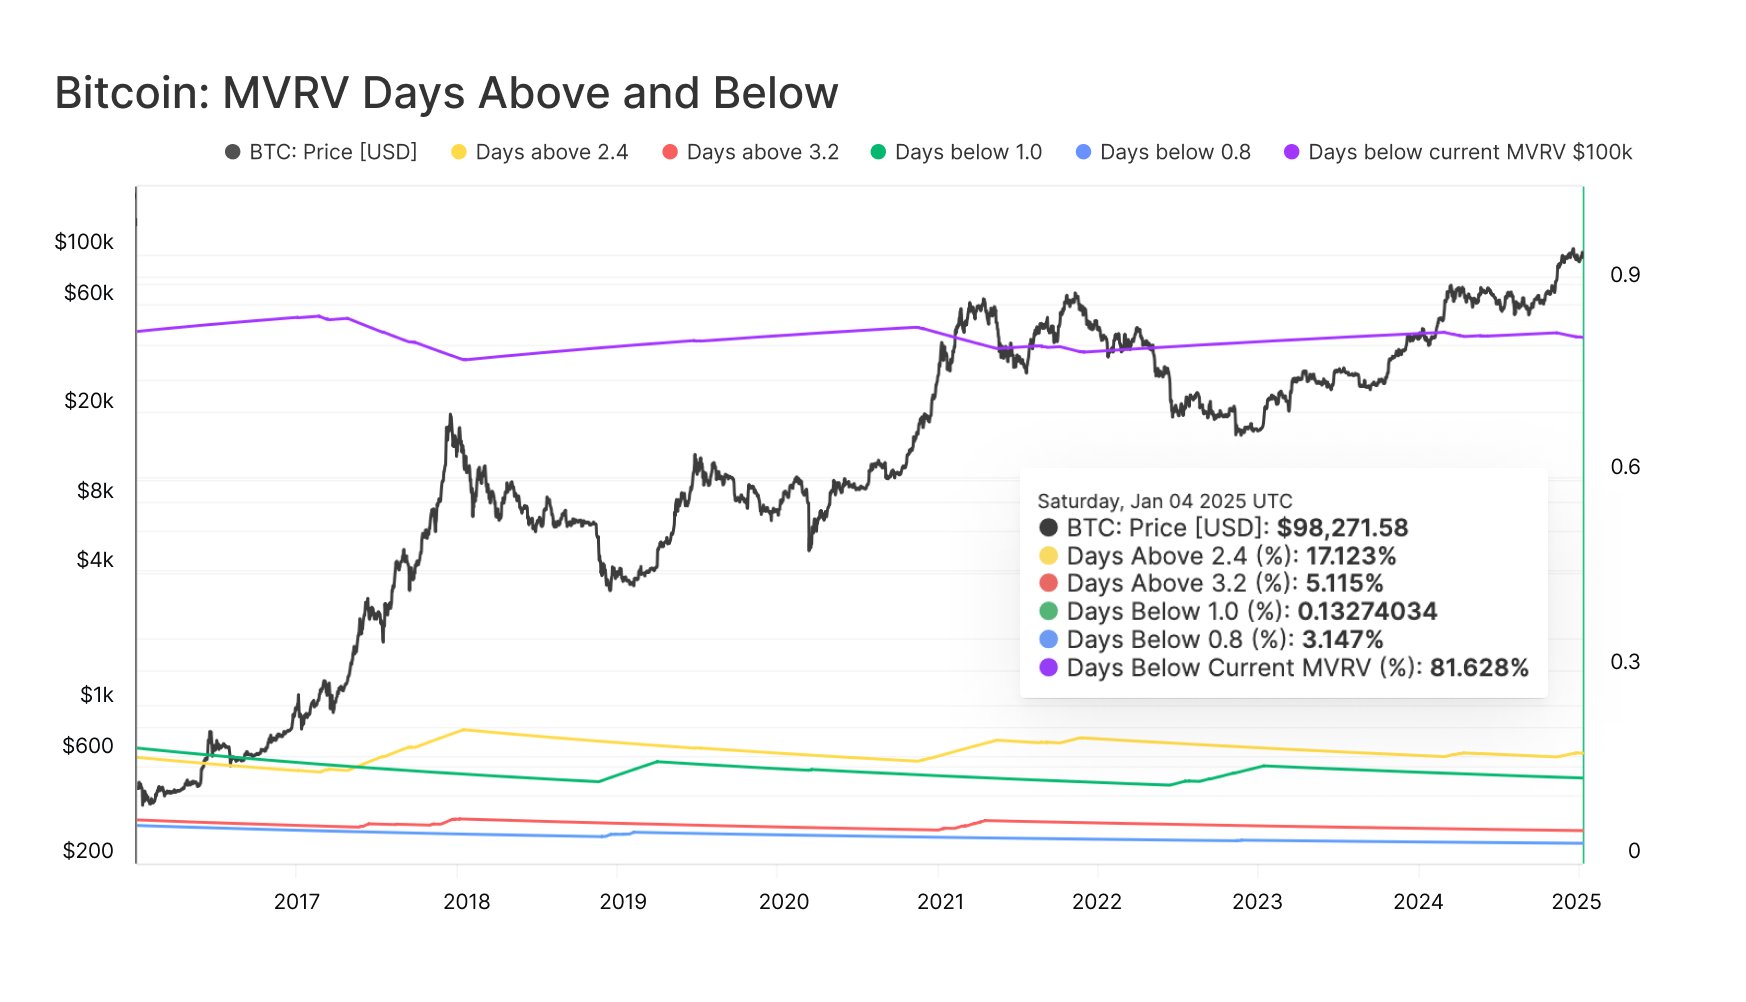
The following chart illustrates how rarely Bitcoin ventures above the 3.2 pricing band:
Days spent above and below the horizontal lines of different pricing band levels as tracked by Glassnode.
"Bitcoin has only spent about 5% of its trading days above the 3.2 MVRV level," explains Glassnode. "This underscores why it’s often labeled as an ‘extreme euphoria’ zone."
So far in this market cycle, Bitcoin hasn’t breached this mark. If we look back at previous bull markets, the top was typically reached beyond this level, suggesting there might still be more room for growth during the current cycle. However, whether this pattern will hold this time remains to be seen.
Currently, Bitcoin is trading at roughly $93,400, reflecting a decline of over 3% in the past seven days.
The coin’s price seems to be on a downward trend.
Featured image courtesy of Dall-E, Glassnode.com, and chart from TradingView.com.


