This article is also available in Spanish.
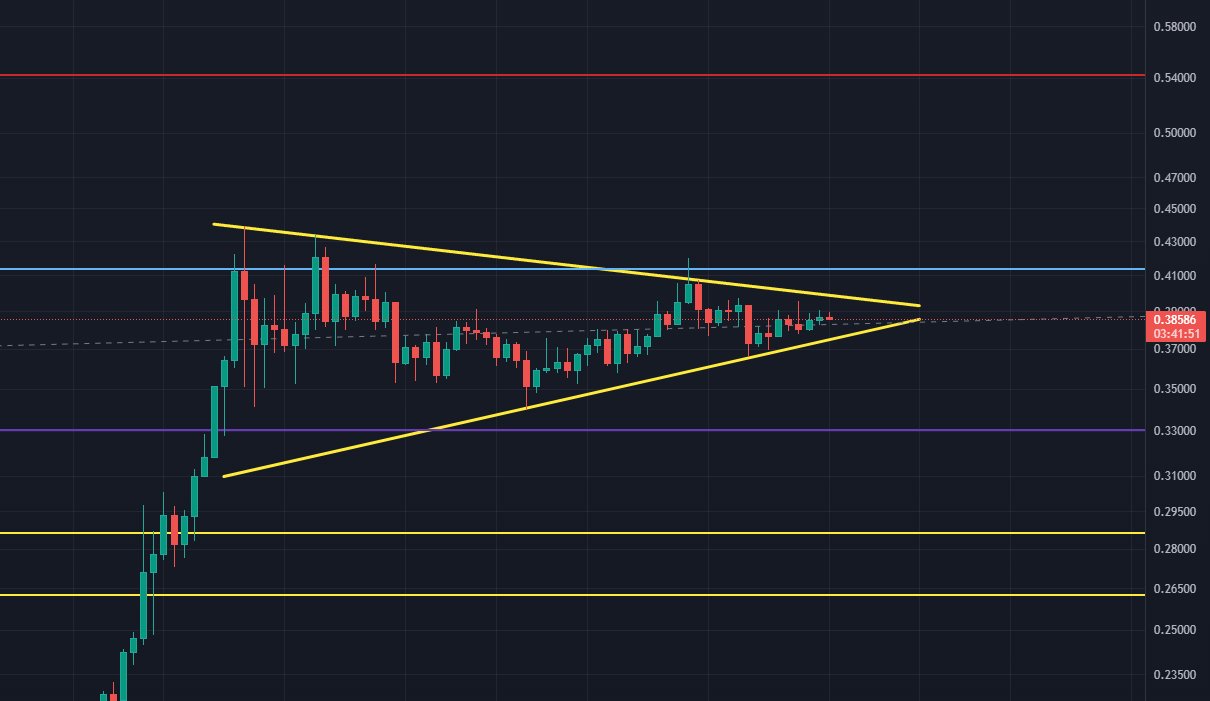
Crypto analyst Kevin, known on social media as @Kev_Capital_TA, has spotlighted an intriguing bullish pennant formation on the 4-hour Dogecoin/USD price chart. This could hint at a substantial price move possibly happening by Saturday. In his recent post on X, Kevin pointed out, “Dogecoin is carving out a clearer bullish pennant with multiple interactions on both sides and ample consolidation time. Folks, keep an eye on this one.”
### Could Dogecoin Break Out by Saturday?
The chart Kevin shared paints a picture of the bull pennant pattern. Typically, a bull pennant suggests a temporary pause in an ongoing uptrend, hinting that the uptrend might continue. This pattern often features converging trend lines, capturing a phase of price consolidation following a significant upward spike.
In Dogecoin’s scenario, these lines are shown in yellow, indicating reduced volatility and a consolidation phase before the big move. The memecoin trades approximately around $0.38 within this structure. Kevin suggests we should brace for a potential breakout “by Saturday at the latest.”
### Breaking Down Technical Terms
Let’s talk technical analysis: a breakout occurs when the price moves beyond the boundaries set by the trend lines in a pattern, hinting at either a continuation or a reversal of the current trend. Given the bullish undertone before the pennant emerged, many anticipate an upward breakout. Yet, Kevin advises a cautious approach, noting the unpredictable nature of markets: “It could go up or down.”
The chart further demarcates several horizontal lines, highlighting key support and resistance levels. The upper resistance is pegged around $0.54, likely a testing ground if the price breaks upwards. On the flip side, immediate support levels are at about $0.33 and $0.2950, crucial if the market decides to head south.
### Deep Dive into Indicators
Kevin also shines a light on the stochastic Relative Strength Index (RSI) on the daily chart. He remarks, “The stochastic RSI is fantastic for gauging momentum in strong trends either way. Dogecoin’s daily RSI seems to be nearly reset, which might need another week or so to fully align. Once it’s set, the next chapter could unfold.”
For those unfamiliar, the stochastic RSI is a momentum indicator comparing the RSI to its range over a certain period, providing clues about potential overbought or oversold conditions. A reset in the daily RSI suggests a wind-down of previous overbought states, which might clear the stage for the next price leap.
Emphasizing the impact of consolidation, Kevin adds, “The longer Dogecoin consolidates, the larger the next move will be. I believe the upcoming move could be the biggest of the DOGE bull run, giving us a hint on where it might top out for this cycle.”
As of now, DOGE stands at $0.39.
Dogecoin price hovers below the 0.5 Fib, 1-week chart | Source: DOGEUSDT on TradingView.com
Featured image created with DALL.E, chart from TradingView.com


