

Ford Motor Company, often simply called Ford, stands as a well-known American automaker with its headquarters nestled in Dearborn, Michigan. With roots tracing back to its founder, Henry Ford, the company officially came to life on June 16, 1903. Over the years, Ford has become synonymous with selling a range of cars and trucks under its own name, while also catering to the luxury market with its Lincoln brand.
FORD (F) Daily Chart August 2024
We’ve had a bearish outlook on Ford since it concluded a wave ((X)) at a high of 16.68. Since hitting that point, the stock continued to trend lower. This set the stage for what we anticipated would be a double correction, marked by waves (W), (X), and (Y), to fully form wave ((Y)). Since the highs of August 2022, we’ve been watching a downward trend play out across seven swings, culminating in a double correction structure with wave (W) wrapping up at a low of 9.63. What followed was a rally that kicked off from this wave (W) low, constructing a structure of three swings that peaked at 14.85 as wave (X).
FORD (F) Daily Chart February 2025
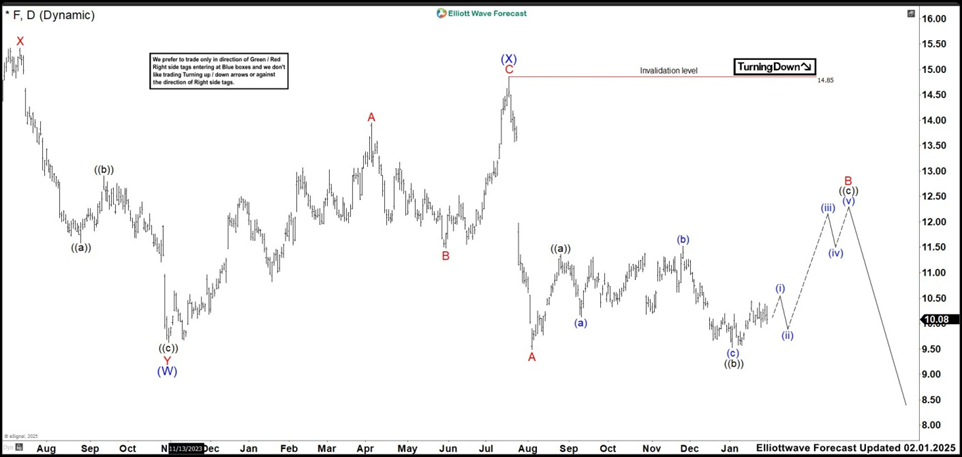
Recently, Ford shares opened with a significant gap that ultimately breached the low seen in wave (W). This movement pointed to at least three additional downward waves needed to complete the bearish cycle we’ve been observing. The past months have seen the market move largely sideways, prompting us to refine our count with the fresh structure in mind. We’ve now marked the sharp decline from wave (X) as A, bottoming out at 9.49. From there, we’re potentially looking at a flat correction pattern of 3-3-5. To complete wave B, we are eyeing a rally into the 11.86 to 12.58 range, after which we anticipate a further drop in wave C of (Y). Our outlook remains bearish, with expectations of the stock possibly dipping into the 7.79 to 3.43 area. At the moment, buying isn’t advisable, particularly not in this prospective wave ((c)) of B. The trend stays bearish against that high mark of 14.85. Stay smart in your trading strategies!


 Decreases by 53.2% in November")


 Faces AI Challenges in the Midst of Tariff Unrest")