As we wave goodbye to 2024, it’s undeniable that the stock market had another stellar year. The S&P 500 Index impressively recorded a gain of over 20% for the second year in a row. In this discussion, I’ll dive into how the stock market has traditionally performed after such strong performances. We’ll also consider what history might tell us about the possibilities for stocks in the upcoming January, given the robust returns we’ve seen. Lastly, we’ll look at the likelihood of the S&P 500 maintaining this momentum for an unprecedented third consecutive year.
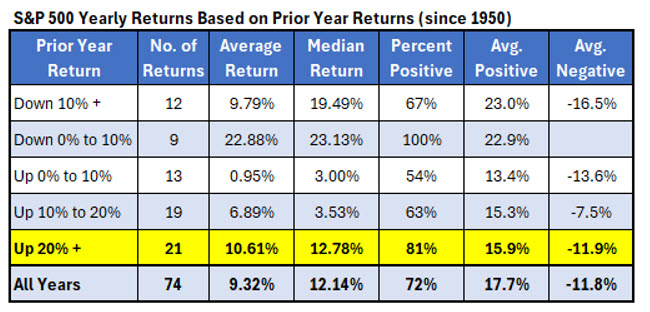
Below is a table that traces the S&P 500’s yearly returns since 1950, providing insights into how the index has fared based on the prior year’s outcomes. With the remarkable surge in 2024, many are optimistic about further gains in 2025. Historically, when the S&P 500 has seen a 20% or more increase in a year, the following year averaged a gain of 10.6%, which surpasses its general average return of 9.3%. Moreover, after such prosperous years, the index posted positive results 81% of the time. Interestingly, the market seems to thrive after modest downturns. Instances where the S&P 500 dipped slightly—though not over 10%—saw it rally all nine times afterward, boasting an average gain of 23% the next year.
However, don’t pop the champagne just yet based on last year’s 20% gain. Historically, January hasn’t been particularly impressive following strong years. Since 1950, the S&P 500 has averaged just over a 1% increase in January, with 59% of those months being positive. In years following a 20% or more gain, the average January performance is roughly break-even, with positive returns only 52% of the time.
After achieving returns of 24% in 2023 and 23% in 2024, is it too optimistic to hope for yet another thriving year in the stock market? Achieving back-to-back 20% gains for the S&P 500 is uncommon, but it has occurred before. A noteworthy occasion was in 1954 and 1955 when the index saw consecutive 20%+ gains, though 1956 started with a 3.6% drop in January and ended with a modest 2.6% annual return. The next instance was from 1995 to 1996, where stocks initially surged, with the S&P 500 jumping over 6% in January 1997, and closing that year up more than 30%. This performance marked another 20%+ gain in 1997. Following that, 1998 delivered a 27% return, making it four straight years of 20%+ gains. Even 1999 came close, with a 19.5% increase, nearly marking a fifth straight year of impressive returns. However, this streak concluded with the tech bubble burst, leading to double-digit losses for the next three years.
So, what’s the key takeaway? There’s no need to dread consecutive strong years in the market. In fact, the last similar streak was followed by three more years of gains, each at least 19.5%.


